![]()
BY KARISSA MILLER
Iredell-Statesville School officials have expressed their frustration over the public comments made during the February 10 board meeting, asserting that those comments created a false picture of the district’s low-performing schools.
According to state criteria, I-SS has 13 low-performing schools based on standardized test scores for the 2023-2024 school year. The individuals who spoke at the board meeting criticized the district for not doing enough to help these schools.
School Board Chairman Doug Knight wants to set one thing straight: I-SS teachers are increasing proficiency of students at the district’s low-performing schools.
“The job of education is not to get to jump over a hurdle that’s so high,” Knight explained in an interview. “The job of education is to take a kid from where they are at and move them in a positive direction. That’s what’s going on in these schools. Our teachers are working hard.”
“When you focus on can a kid jump this high — you aren’t focusing on meeting a kid where they are at — on a one-day test,” he added.
Superintendent Jeff James said that school performance grades don’t tell the whole story of what’s happening in I-SS classrooms.
“The district is committed to improving school and district performance and increasing preparedness to meet the needs of every student,” James said.
The students aren’t low performing, he continued, rejecting that categorization.
“Every school has growth. So, when we stop talking about what we are not doing, we might actually have some people apply to our district that have a (teaching) license,” he added.
The superintendent said that as the state emerged from the pandemic in 2021, I-SS was one of the few districts to open the doors to students.
“That year, we were the No. 1 school system in the state for growth,” James said. “We could take a month to explain the formula, but imagine a baseball player with a 350 RBI and hit 400 this year. You don’t go backwards; you now have a new bar set.”
“When you raise the bar, it becomes your base. For us to maintain that base, it was almost impossible,” he added.
Because the district established a higher baseline for student proficiency, it made it more difficult to improve testing outcomes.
The Board of Education’s responsibility, James said, is advocating to bring about the progress all students deserve. The test itself is part of the problem because it uses a “value-added measure” system (VAM).
The American Statistical Association cautions that “VAMs are generally based on standardized test scores, and do not directly measure potential teacher contributions toward other student outcomes.”
Additionally, James said that the 80/20 school performance grading system needs to be revamped.
The school performance grade, which was established in 2013 by the N.C. General Assembly, determines school grades by putting an 80-percent weight on standardized test scores and 20-percent on whether student performance grew relative to expectations. The law labels schools with “D” or “F” grades that either met or did not meet growth expectations as low-performing schools.
“The problem is we get beat up all the time over the model when we know we are growing kids,” James said. “When a board member stands up and comments that we need to roll up our sleeves and go to work, these teachers at N.B. Mills are busting their hind ends that don’t have to hear that.”
James said that teachers are doing their jobs and have to meet students where they are.
“In poverty, we have to do a universal pre-K because some of these students are coming in two and a half years behind,” James said.
James said that NAEP data affirms North Carolina schools are performing considerably better than their state performance grades otherwise suggest.
The disproportionally large numbers of D and F schools in North Carolina, as compared to other states, prompts two questions:
• How can North Carolina strengthen the validity of its accountability system for assigning school performance grades?
• How might evolving values and priorities of North Carolina stakeholders influence revisions to the current system and its intended uses?
According to preliminary findings of I-SS’ climate survey, which gathers data on how teachers, students and parents feel about the district, the Superintendent said an overwhelming majority of parents are happy with the education that their child receives.
Each year, the school board reviews and adopts School Improvement Plans (SIPs). One of the requirements of low-performing schools is the development of a school or district plan for improvement that specifically addresses the strategies the school or district will implement to improve both the School Performance Grade and School Growth designation. The plans are available to the public, including parents and staff, through the district’s website and NCDPI website.
Making an Impact
District employees take the public criticism personally, I-SS Chief Elementary Academic Officer Jonathan Ribbeck said.
“Schools that keep being brought up — the staff and teachers are getting very frustrated. They feel like all we keep hearing about is ‘We aren’t doing our job. We aren’t making an impact,’ ” he said. “If you look at data, they are making an impact.”
I-SS officials said that NC check-in data and other testing programs indicate that students are making progress in reading and math. Teachers are able to help come up with a plan or provide additional tutoring if a student is struggling based on their results.
According to district officials, other claims made by those at the meeting are completely false.
For example, critics claimed that I-SS has some schools with a 50-percent attendance rate.
“In my 29 years here, we have never had a school that has had a 50-percent attendance rate,” said I-SS Director of Accountability, Testing and Data Laura Elliot.
According to I-SS Chief Student Services Officer Shayla Savage, every student that has missed 11-plus days must have an individual plan with a school social worker.
“We know exactly who is here, whether it’s sickness or if it’s not. We are well aware of any student who has chronic attendance issues,” Savage said.
According to I-SS attendance data, the district has maintained a 92.36 average in attendance for the 2023-2024 school year, which is a slight improvement over last year’s attendance ratio of 92.02.
District officials explained that these false claims spread in news outlets and on social media, which serve to undermine confidence in the schools’ efforts to create a welcoming, positive school culture.
“We are held accountable and must give accurate data whenever we share information. The people who speak at a meeting should give accurate data,” said I-SS Chief Secondary Academic Officer Kelly Cooper.
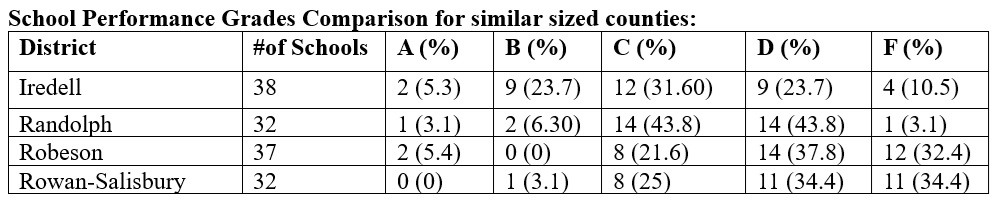
School Performance comparison
The Superintendent said that each school system is unique in its makeup and an apples-to-apples comparison is hard to achieve. However, when comparing school performance letter grades to districts in similar size, I-SS has a smaller percentage of failing schools for the 2023-2024 school year.
School choice hurts scores some schools’ results
Officials said that the district’s internal choice programs, such as early college and International Baccalaureate (IB), are contributing to some of the district’s low-performing schools by drawing higher-achieving students away from their “home” school.
According to I-SS’ data, the total membership currently in choice programs is:
• 4,965 elementary grades;
• 2,808 secondary grades;
• 7,773 total or 38-percent of 20,849 students.
According to data compiled by the district, if the IB and early college students attended their home school, standardized test scores would look different. They ran a scenario of what test scores would look like if the IB and Early College program students attended their homeschools.
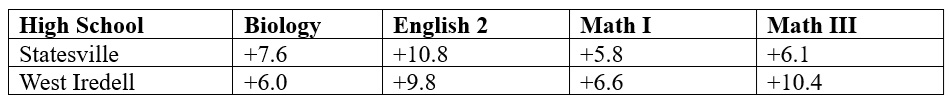
“All of our high schools would be a B or a C letter grade,” James said.
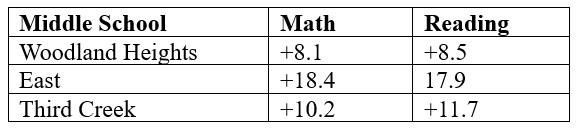
If the middle school students in choice programs attended their home schools, this is what the test results would reflect:
Measuring student success in a variety of ways
Despite this, I-SS is performing in line with the state average and exceeding it in standard metrics and alternative metrics of success, James said.
District officials that there are other metrics and indicators that show student learning, which include:
• One alternative measure is the district’s ACT WorkKeys silver certificates or higher at 72.7-percent, which is 12.7-percent above the state average of 60.
• International Baccalaureate (IB) percentage passing exam rate is 70-percent; whereas the state average is below 70-percent.
• The district’s graduation rate is 86.5-percent, which is slightly lower than the state average of 86.9-percent.
• The five-year cohort graduation rate is 90.1-percent.
• Students reading proficiency increased by 11 points from the start of the 2024-2025 school year to mid-year at N.B. Mills, according to iReady diagnostic data. This helps track each student to see how much they are growing in proficiency from the beginning of the year to the end of the year.
Key Factors of Low-Performing Schools
Low-performing schools are difficult to turn around due to a complex number of issues, including being underfunded, poverty, a lack of teachers, deeply ingrained negative school culture and other issues, district officials explained.
Districts grapple with low funding
School districts may lack funding for low-performing schools due to below average property taxes and low state funding. This can lead to underfunded schools, which can negatively impact student learning, officials stated.
“We get about a 3-percent increase each year in our current expense budget,” James said. “The problem is when the state goes up from paying someone $11 to $15 anyone that’s paid out of the local budget has to go up, too.”
James said that in order to meet a state required raise, the district has to take the funds out of their local budget to increase the pay of those employees that are paid out of the district’s local budget.
“We need around 8-percent just to remain even,” James said. “Last year, we presented a 14-percent budget increase request. From that point, it’s up to the board (of commissioners) to solidify that funding. That battle is not mine after that point.”
“Unfortunately, it’s a fight and the ones stuck in the middle are our kids,” James said.
Key Findings
• I-SS is ranked near the bottom of Per Pupil Expenditures at 100 out of 116 in the state, according to N.C. Department of Public Instruction.
• I-SS ranks 98 out of 116 for federal PPE, which makes up 20-percent of the district’s budget.
• I-SS ranks 110 out of 116 in state PPE. This is where 60-percent of the district’s budget comes from.
The Impact of Poverty
Students from low-income backgrounds often face challenges outside of school that impact their ability to learn, including unstable housing, food insecurity and limited access to resources.
Schools that serve mostly low-income students don’t have as many resources as those serving high-income students.
“Nobody ever talks about Maslow’s Hierarchy of Needs,” Cooper said. “If kids aren’t safe, secure and fed, it’s hard for them to learn.”
Some schools, she said, are trying to meet basic needs.
“We have kids who don’t even have basic school supplies in their home, whether it’s a pair of scissors or set of crayons or colored pencils. Is it more important to feed myself or have a colored pencil?” Cooper said.
At N.B. Mills, which has a 95-percent free and reduced lunch population, that is an indicator of being socially disadvantaged.
Some of the initiatives already in place that will make a difference to students at low-performing schools include:
• Recruitment and retainment of highly qualified teachers.
• Developing a plan for districtwide opportunities for focused tutoring.
• Advocating for universal pre-K program so that the district can close gaps.
• Professional development opportunities to support instruction.
• Charter-like flexibility for some of the schools.
By the Numbers
• I-SS has around 20,849 students for 2024-2025 school year, which is up from 20,501 students for 2023-2024 school year.
• In 2023-2024, North Carolina’s traditional public schools outperformed charter schools. Public schools had the highest percentage of “exceeding growth” at 27.1-percent with 677 schools compared to 24.3-percent and 51 charter schools.
From my perspective it feels like the funding is a big problem. Our elected officials approve rezoning and the building of new subdivisions at almost every meeting, it seems. Yet when we have an influx of new students, and therefore a need to increase the school budget, where is all the “revenue” this development of our county is supposed to bring in? If it’s not for the benefit of our children and our schools then where is this money going?
I am sick and tired of Paula Mimnaugh and her boot lickers making up lies about our schools. Why would anyone come teach here and have to deal with this garbage.
PS. Hey Puppet Master, what happened to your radio show?
Amen, we all are. She needs to call Ronald, go by and pick up Hamburglar and head to Pennsylvania.